Question on how/when you run these wave charts. I printed Gold chart dated 7/29 and then again on 8/14. As of 7/29 or days later I was looking for a big drop, however, gold shot higher. It looks on the 8/14 chart you adjust the wave for now gold should drop. How many times do you adjust these charts? I thought they would be based on historical prices. It sure seems that 2019 August price really adjusted the chart which I thought would be just a minor one.
Any comments is appreciated.
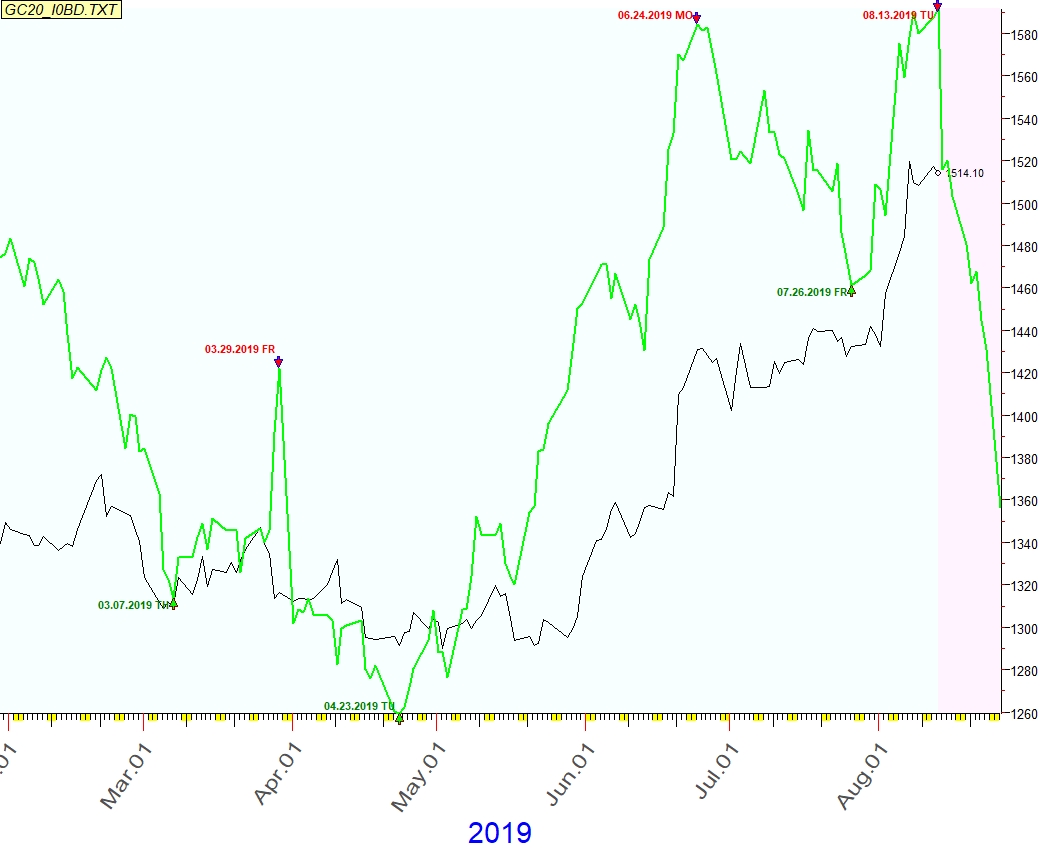

Randy Wegener August 16, 2019
Question on how/when you run these wave charts. I printed Gold chart dated 7/29 and then again on 8/14. As of 7/29 or days later I was looking for a big drop, however, gold shot higher. It looks on the 8/14 chart you adjust the wave for now gold should drop. How many times do you adjust these charts? I thought they would be based on historical prices. It sure seems that 2019 August price really adjusted the chart which I thought would be just a minor one.
Any comments is appreciated.