What a year 2020 has been, right? And it’s shaping up to get even weirder with the upcoming election.
Historically, volatility in the stock market increases in the months leading up to an election. Why? Because the markets hate uncertainty.
And this election has it in spades … so buckle up!
As an investor, you might be wondering, “How do I position my portfolio for a President Trump reelection … or a Vice President Biden victory?”
Although the stock market doesn’t always reflect economic reality for everyday folks — as we’ve clearly seen — both have played major roles in presidential elections.
Regarding the economy …
Every president in the past 100 years who avoided a recession was reelected. Only President Calvin Coolidge won reelection when there was a recession in the two years leading up to the vote. And that was 96 years ago … in 1924.
So the “coronavirus recession” would be a strike against Trump … and a boon for Biden.
Regarding the stock market …
The performance of the S&P 500 in the three months before votes are cast has predicted 87% of elections since 1928 and 100% since 1984. When returns are positive, the incumbent wins. If negative, the incumbent loses.
As of market close on Oct. 23, the S&P 500 was up 6.8% year to date, and up 5.38% since Aug. 3. That helps Trump … and hurts Biden.
So whoever wins, it’s going to be a historical anomaly.
Your next question might be, “What about returns the year AFTER an election?”
U.S. stocks and bonds tend to perform better during an election year compared to the year after. But is there a difference between a “Republican” market and a “Democratic” one?
See for yourself …
All mostly “winners” … at least for investors.
But the party who wins the presidency is just one factor. Here are some statistics about control of the White House and Congress from Dan Clifton of Strategas Research Partners:
• Since 1933, the highest returning “combination” for the S&P has been a Democrat-controlled Senate, Republican-controlled House and a Democrat President … where returns averaged 13.6% per year. In 2020, this would require a reversal of all three!
• Our current mix of Republican-controlled Senate, Democrat-controlled House, and Republican President averages a 10.8% return. This combination is likely if President Trump wins reelection.
• If Biden wins, the likely scenario is a Republican-controlled Senate, Democrat-controlled House and (of course) a Democrat President. Interestingly, this combination hasn’t existed since Grover Cleveland in 1886!
But I like what Bruce Weininger, principal and senior financial advisor at Chicago-based wealth management firm Kovitz, wisely says …
“If you let politics drive investment decisions you will have bad results.”
Managing your portfolio is challenging in any year. And even more so in an election year. And even more so in THIS election year!
Here are a few points to keep you relatively sane:
Ignore the headlines. For the media, presidential elections are political Super Bowls. Advertising money flows, and it’s a game to capture the most eyeballs. So, take what you read and hear with a grain of salt.
Focus on what you can control. Stressing about what might happen under the different permutations of the election won’t help. Instead, direct your energy on what you can control, like how diversified you are against market volatility.
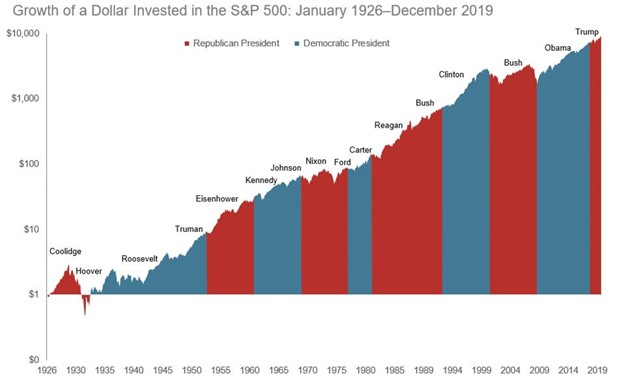
Zoom out. Looking at the chart above, stocks have gone up — and down — under all presidents. But over time, the trajectory has been positive. Getting too hung up on what-ifs means losing sight of the big picture.
Most importantly, stay tuned to my guidance in these issues. And if you follow my recommendations in Wealth Megatrends … all the better.
The bottom line is to step back, put personal feelings about politics aside and objectively assess the situation and what it might mean for your personal finances.
To that end, we’re here to help with our latest free resource …
The Weiss Ratings Election Report 2020
We’ve analyzed every presidential election since 1992, looking at the performance of major market sectors from the day after the election through the next 180 days.
Next, we selected fifty “BLUE” stocks from those sectors that outperformed when a Democrat was elected (President Clinton and President Obama) …
… and fifty “RED” stocks from those sectors that outperformed when a Republican was elected (President George W. Bush and President Trump).
Finally, we put all this information together in one must-read election report. Get it for free here.
All the best,
Sean
P.S. In case of a CONTESTED ELECTION, the report also includes a list of fifty “PURPLE” stocks from sectors likely to do well whatever the outcome. We’ll explore this (quite likely) situation next week.